JavaScript Error Tracking from remote user browser using Google Analytics
Although you can code and debug carefully your javascript code using “use strict” and try catch statement, there might be a situation where unexpected errors can occur for several reasons.
- Collision of namespace or variables.
- Scripts timeouts
- Syntax errors due to encoding or escaping.
- Thirdpary plugin (in wordpress, joomla, drupal) may creating javascript issues.
- You may not have tested your in mobile browser like iphone or android.
So, here are the tips to get error logged into your google analytics account using event tracking.
window.onerror function
It’s an event handler for runtime javascript errors.
window.onerror = mycustomErrorFunction
window.onerror() paramteters
- First one is – Error String
- Second one is – Error document or script URL
- Third one is – Line Number
- Forth one is – Column Number (may not support in all browser)
- Fifth one is – Stack Trace (may not support in all browser)
Basic Error Tracking Syntax
window.onerror = function(error_message,error_file,line_number)
{
// your code here
}
Error Tracking using Google Analytics
window.onerror = function () {
"use strict";
var errors = Array.prototype.slice.apply(arguments);
var error_message = errors[0];
var error_url = errors[1];
var error_line = errors[2];
var error_column = errors[3] + 1;

var line_string = isNaN(error_line) ? "" : " (line: " + error_line + "";
var column_string = isNaN(error_column) ? "" : ", column: " + error_column + ")";
var error_event = "[" + error_message + "][" + error_url + line_string + column_string + "]";

if (typeof (_gaq) != "undefined") {
    _gaq.push(['_trackEvent', 'Exceptions', 'JS errors', error_event, null, true]);
} else if (typeof (ga) != "undefined") {
    ga('send', 'event', 'Exceptions', 'JS errors', error_event);
} else {
   // add your own code for other analytics code like Piwik, Open Web Analytics etc.
}
return true;
}
Viewing client side javascript errors with Google Event Tracking
- Login to your google analytics
- In Left Navigation panel find Behavior
- Click Events then Overview
- You will find Exceptions in Event Category, Click on it
- Then new screen will appear, find Event Label within Primary Dimension filters and click it.
- There you will get all errors. See demo screenshot below
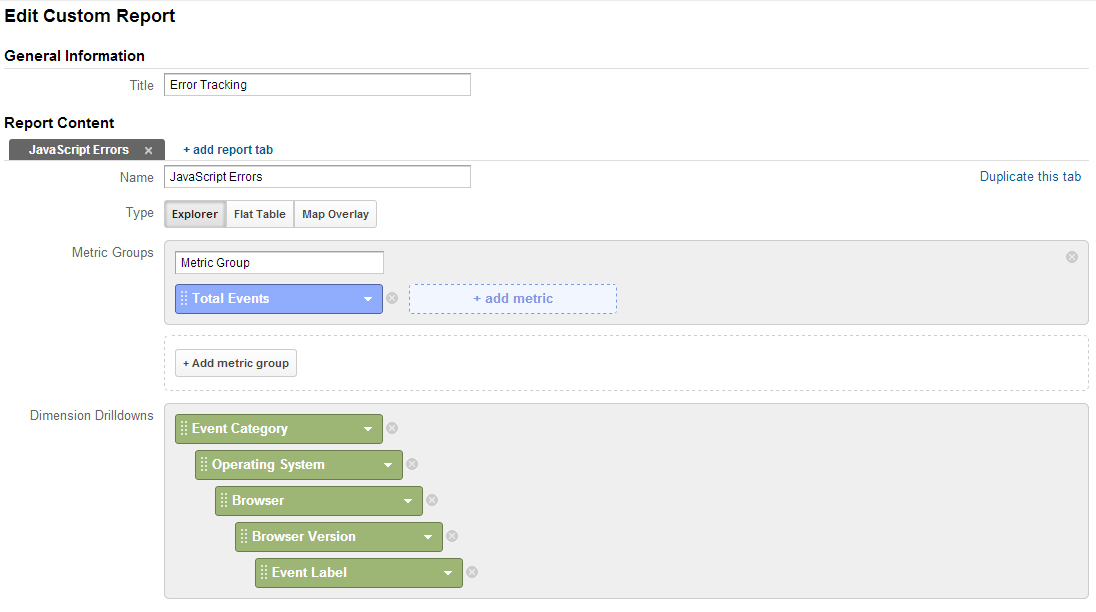
Creating Custom Report to get operating system / browser / its version wise error breakup
- From top orange bar in google analytics, find Customization next to Reporting tab.
- Click + New Custom Report
- General Information = Error Tracking
- Report Content => Name = JavaScript Errors
- Metric Group = Total Events
- Dimensions Drilldowns =>
Event Category > Operating System > Browser > Browser Version > Event Label - Finally Click Save.
Viewing Custom Report
- Again select Customization tab from top orange navigation bar.
- Select and click Error Tracking
- Click Exceptions
- Click Operating System you want to check errors for.
- Then click Browser and then its version
- Now errors are precisely breakup by browser version so go ahead and fix your javascript error for that particular browser.
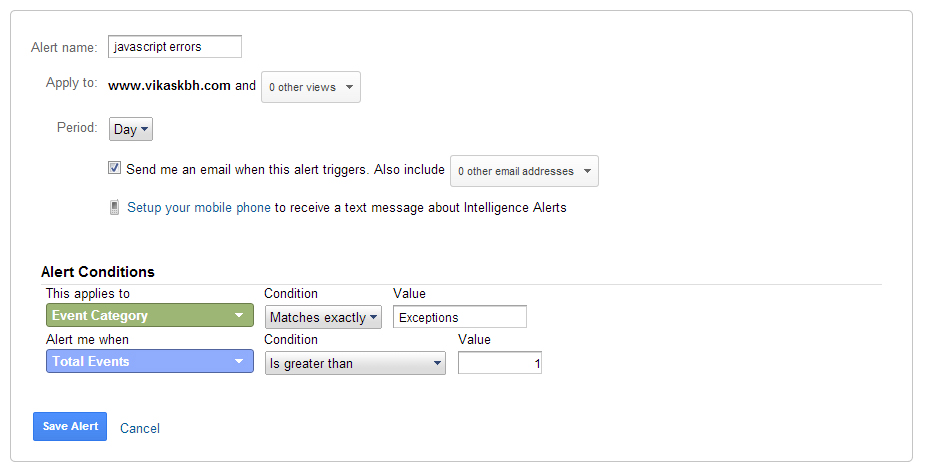
Getting Error Alert from Google Analytics Intelligence Event feature
You can get daily email from google analytics for your custom alerts. So, lets create daily events alert for above javascript event tracking.
- Navigate to Intelligence Event (in left menu)
- Click Daily Events and find + Create a Custom Alert
- Set Alert Name = javascript errors
- Period = Day
- Alert Conditions => Event Category [Matches exactly] Exceptions
Alert me when => Total Events [Is greater than] 10 - Save Alert
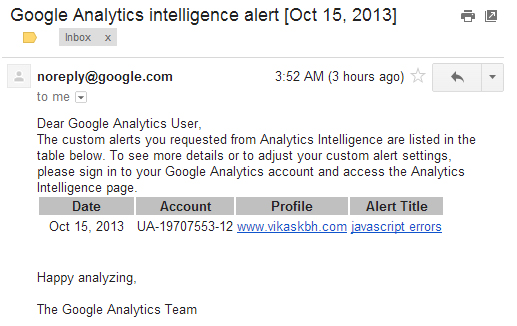
Now you should get daily javascript error in your email. You can even setup your mobile phone to receive message about above report in above configuration.
Wrapping Up : How to use above code in your website?
- Download http://code.vikaskbh.com/ga_error_tracking/error.js
- Include javascript in <HEAD> tag of your document.
<script src="/path-to/error.js" async></script>


